


Atlas.md allows you to utilize growth charts in the Vitals & Stats section to chart your patient’s growth.
Patient vitals such as height, weight, BMI, and more can be entered manually by clicking the plus sign in the upper right corner of the screen.
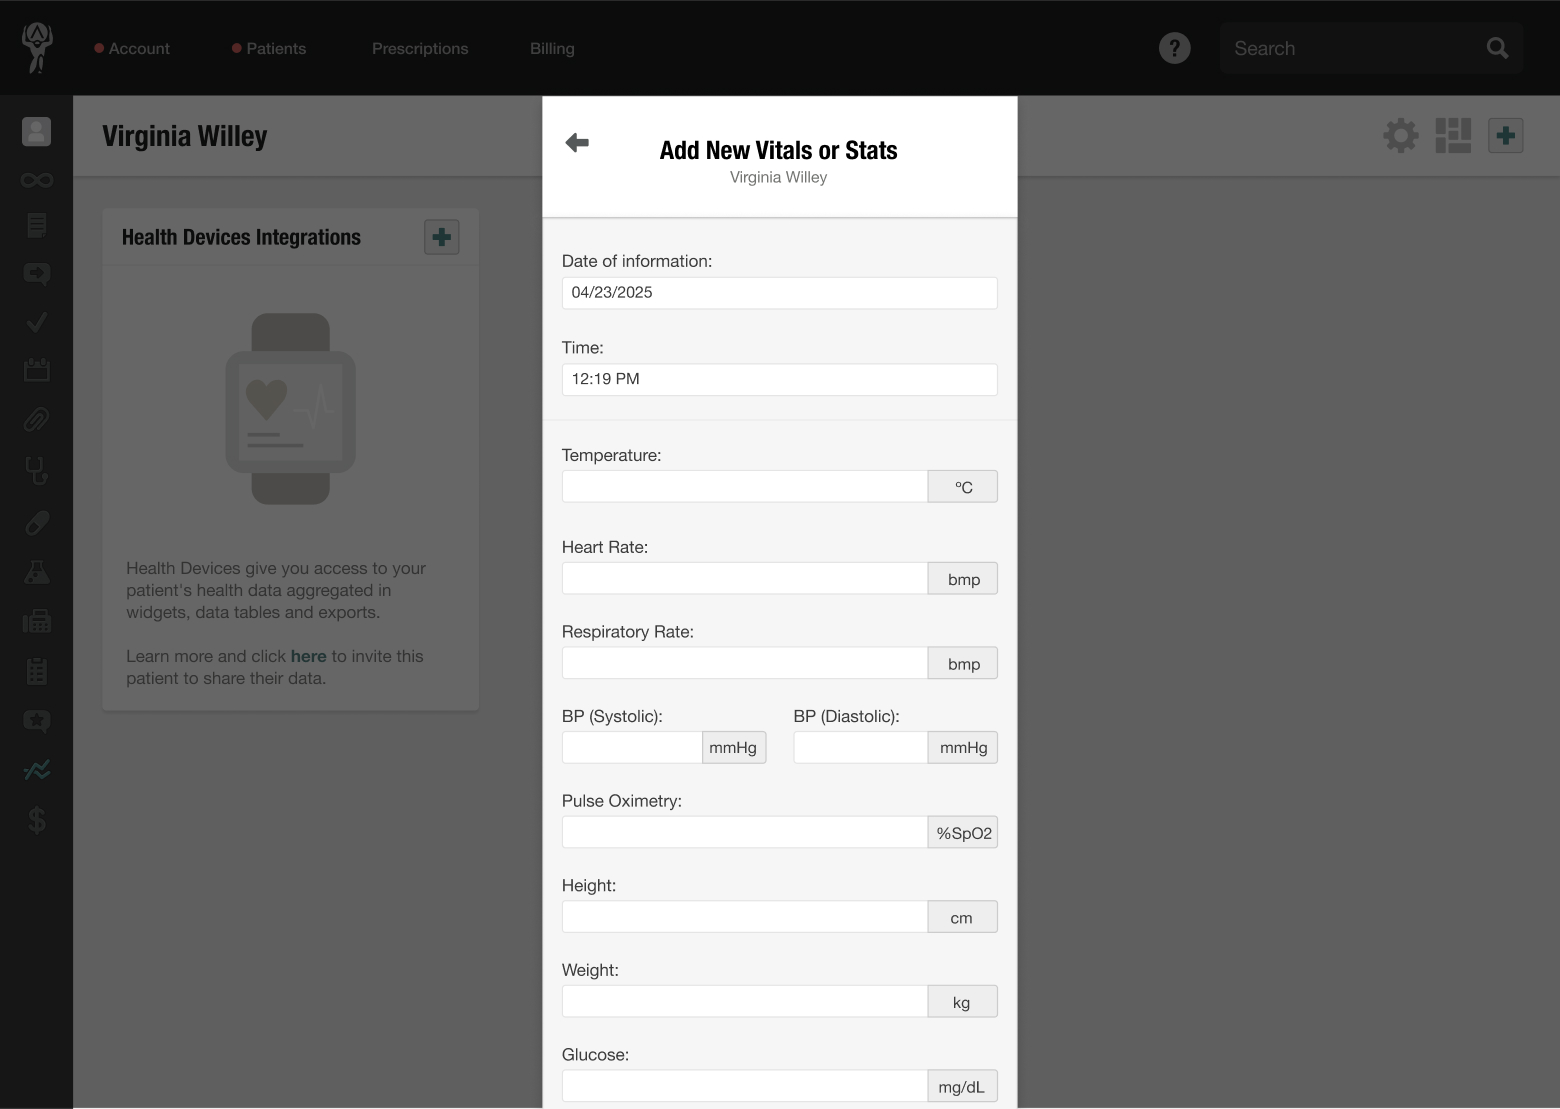
They can also be gathered by integrating third-party devices and apps like Fitbit.
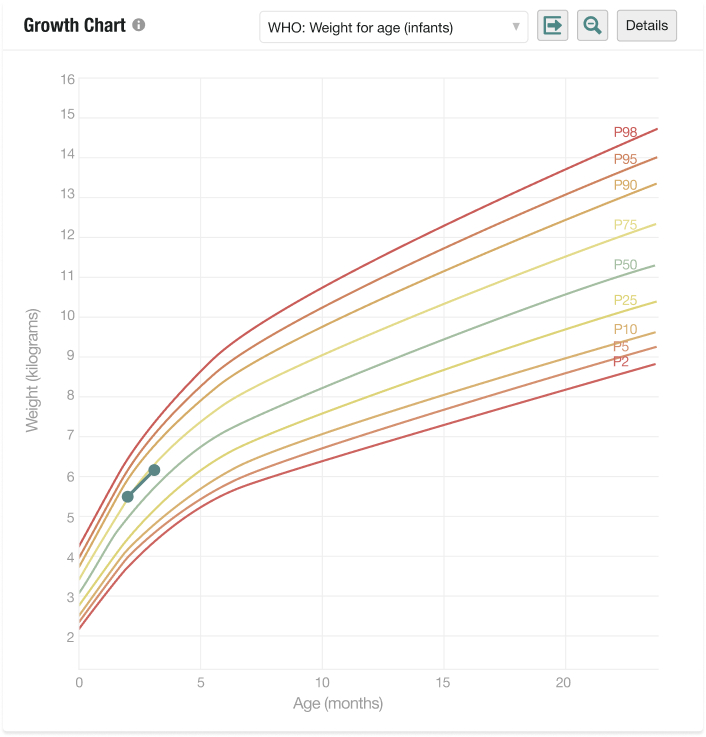
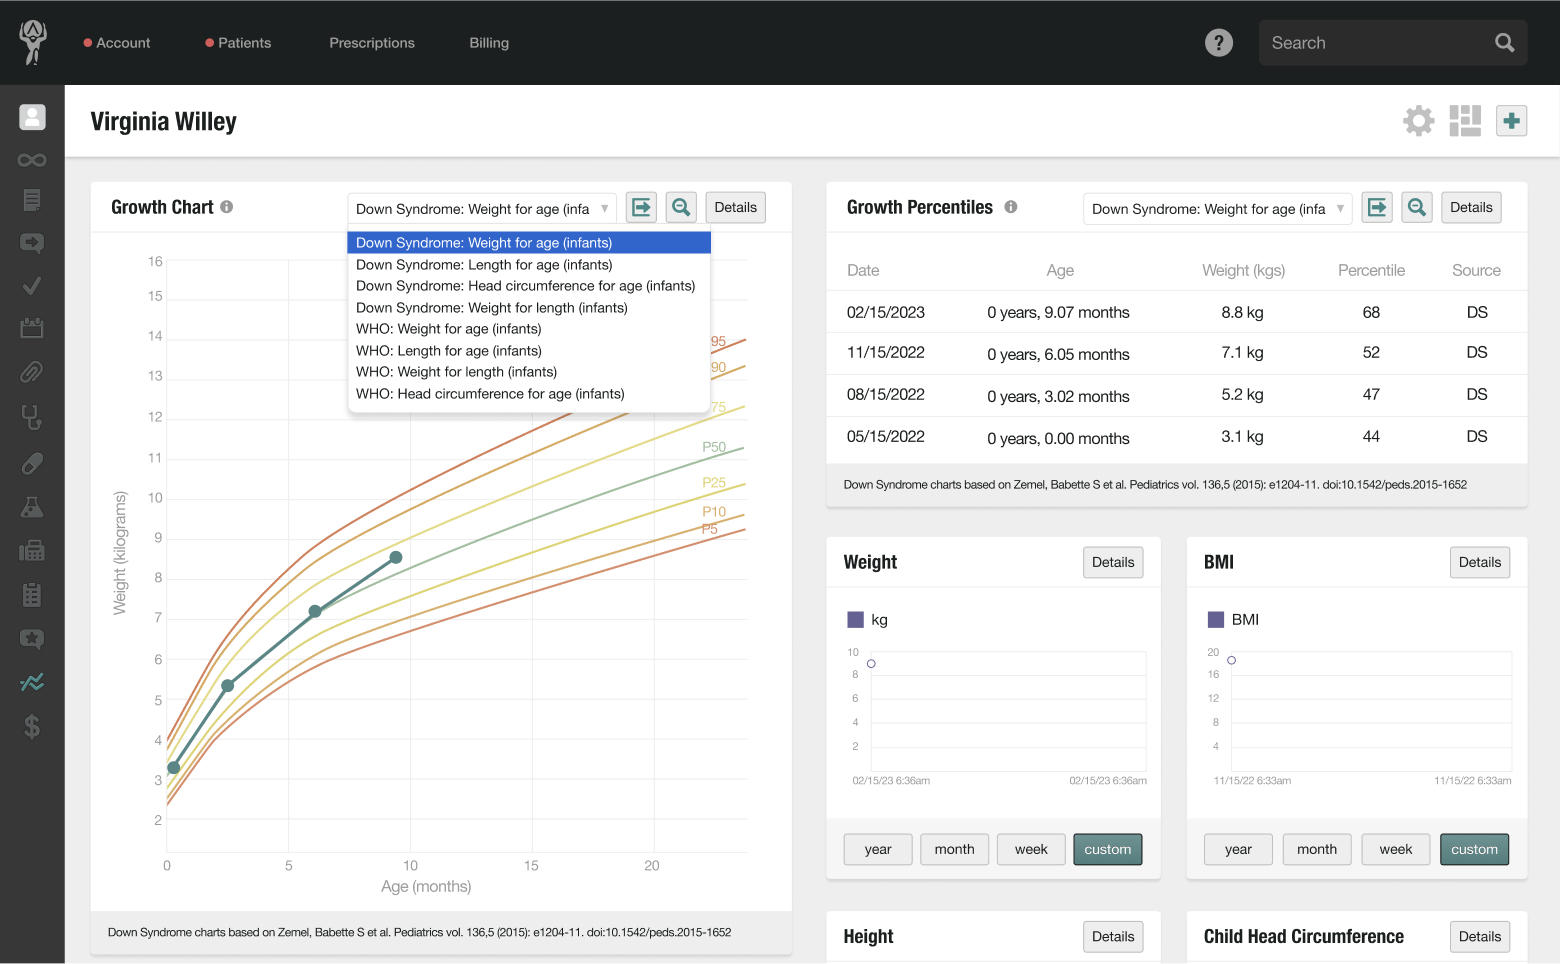
Once collected, Atlas.md will automatically display the data on visual Growth Chart graphs:
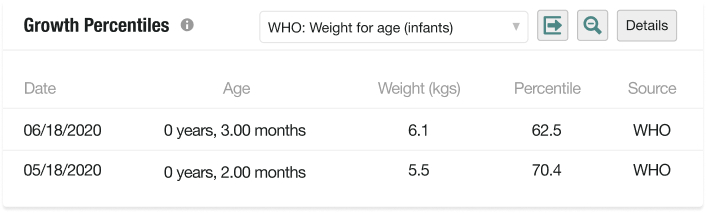
And easy-to-read Growth Percentiles tables:
Both graphs and tables will appear in the Vitals & Stats section of the patient’s chart.
The tables and graphs use standards the World Health Organization (WHO) set when charting patients from 0 – 2, and the Center for Disease Control (CDC) for children aged 2 years and older.
Depending on the data that has been gathered, you’ll be able to review the following charts from the dropdown menu at the top of the widget:
- Weight for age
- Length for age
- Weight for length
- Head circumference for age
- BMI for age
- Stature for age
Entering Past Information
In some situations, such as registering babies’ full weight and height histories, you may need to enter past data on a patient.
You can do this in the Vitals & Stats section:
- Select the Details button on the growth chart or table
- Hover over the row of data you want to change
- Select the edit icon on the right. From there, you can edit the date the information was entered to reflect past data.
Printing Growth Chart Graphs and Growth Percentile Tables
Growth chart graphs and growth percentiles tables contain a breakdown of the datasets for deeper and more precise analysis.
To print a graph or table:
- Click the arrow button next to the dropdown menu on the widget, and select Print chart
- You can print multiple charts simultaneously by clicking Print All Charts in the same dropdown menu
Down Syndrome-Specific Growth Charts
Atlas.md includes specialized growth charts tailored to children with Down syndrome to help you track development with greater accuracy and clinical relevance.
These charts automatically appear in the Fitness & Stats section when a patient has been tagged with a Down syndrome diagnosis using the appropriate ICD code. They are displayed alongside the standard WHO and CDC charts, giving you a complete set of comparative growth data in one place.
How to Tag Down Syndrome as a Chronic Condition
To enable Down syndrome-specific growth charts, the patient must have a chronic Down syndrome diagnosis recorded in their chart with one of the following ICD-10 codes: Q90.0 – Q90.9.
Here’s how to add it:
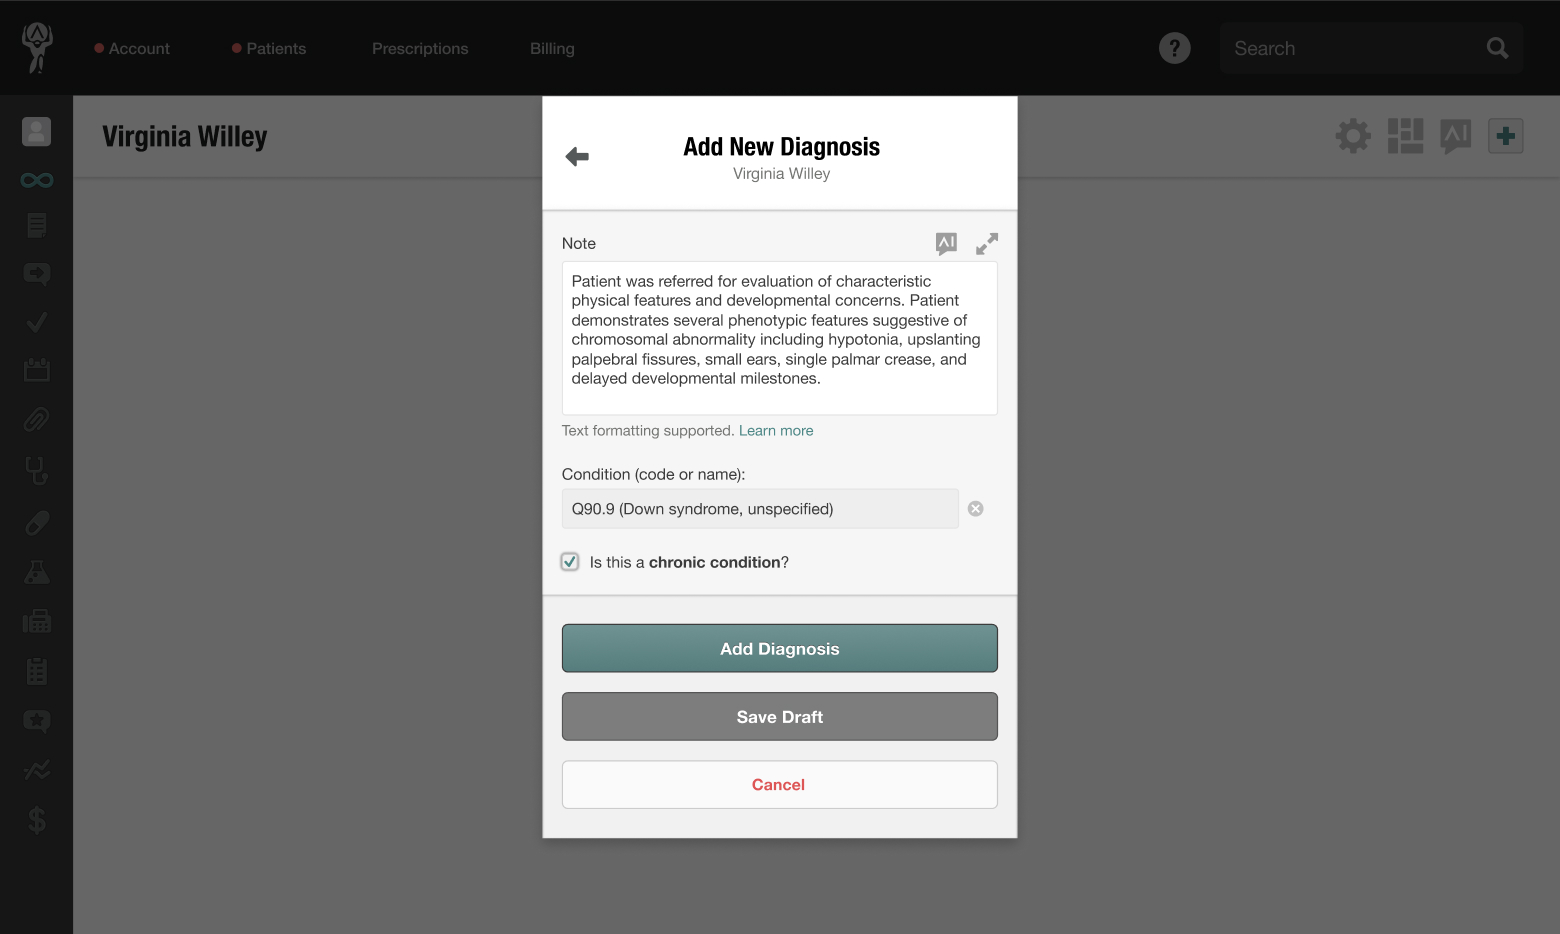
- When adding a diagnosis, begin typing “Down syndrome” or enter the specific code (e.g., Q90.0) into the search bar
- Select the appropriate result from the list
- Check the box next to “Is this a chronic condition?”
- Save the condition
Once saved, Atlas.md will automatically recognize the diagnosis and display the appropriate growth charts based on the patient’s vitals and age on the Fitness & Stats page.
These charts follow growth curve standards specifically developed for children with Down syndrome and integrate into the growth percentiles widget for quick insights.